Configurable Dashboards for Everyone on the Factory Floor
Share
Over the summer, we introduced a new feature called Dashboards, which is now available to all Oden users, and we’ll be continuing to add enhancements.
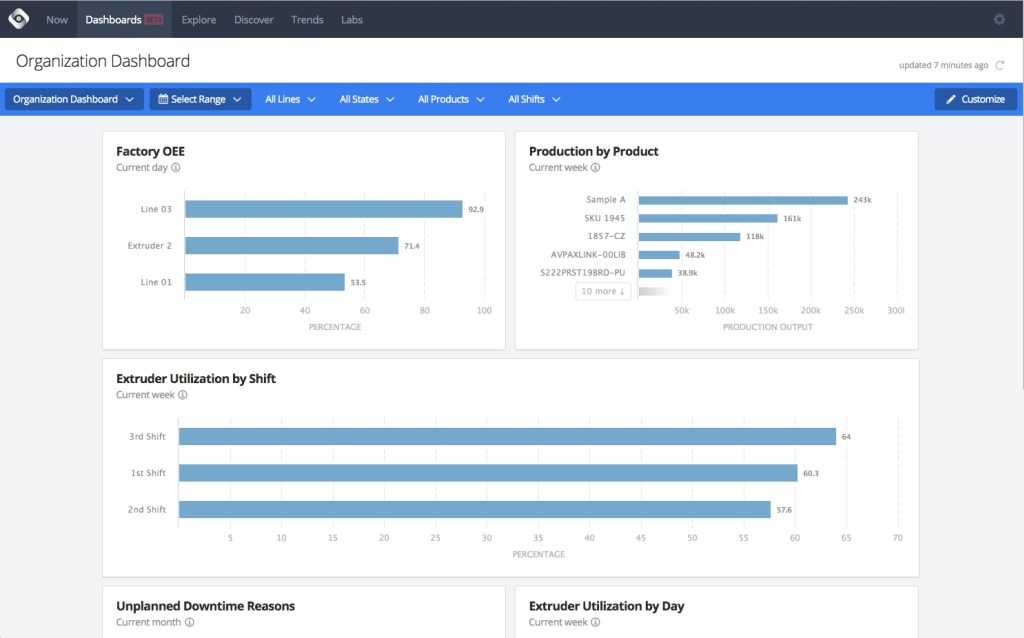
Using the Dashboards feature, you can create and configure dashboards to reflect targeted KPIs within your factory, so different teams can focus on their specific goals. We expect that these will prove invaluable for your regular reporting or use in standing meetings.

With these configurable Dashboards, you can now create:
- A shift production dashboard for supervisors to report on production for their shift and the previous shift across each line or product
- A dashboard focused on utilization and performance for specific zones in your factory over the past month
- Charts to report on top downtime reasons for a part of your factory, or changeover duration in different shifts
- Charts to evaluate the performance of a key product group over the past few weeks
- Other configurations tailored to your factory’s workflow, with more options to come
When viewing any of your dashboards, you can also use the dashboard’s global filters to change the time range for all modules, or focus them all on the same specific lines, states, products, or shifts. For example, you might want to see all of a Dashboard’s modules focused on Line 3 for October 1-7.
Within Dashboards, you can also choose to have your data align with the first shift of your production day. With that option selected, creating a chart that shows data for ‘yesterday’ will show yesterday’s data beginning with first shift (rather than midnight).
Dashboard creation and configuration
Dashboards can be created and modified by any Oden user with Administrator permissions. Each dashboard will be visible to all users on your account, but the data in them will be limited to the areas of the factory each user has access to.
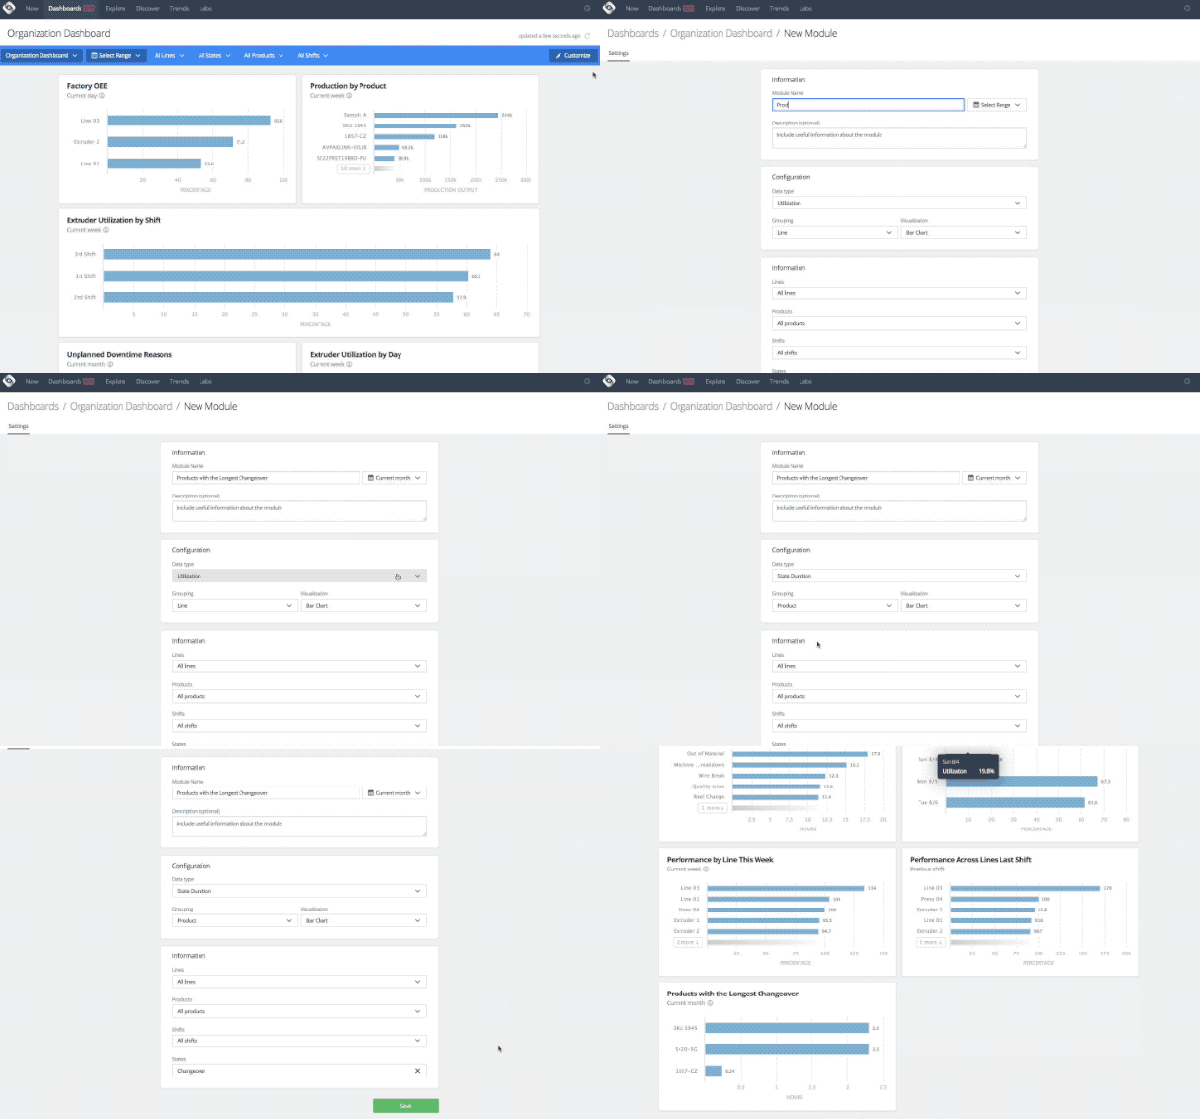
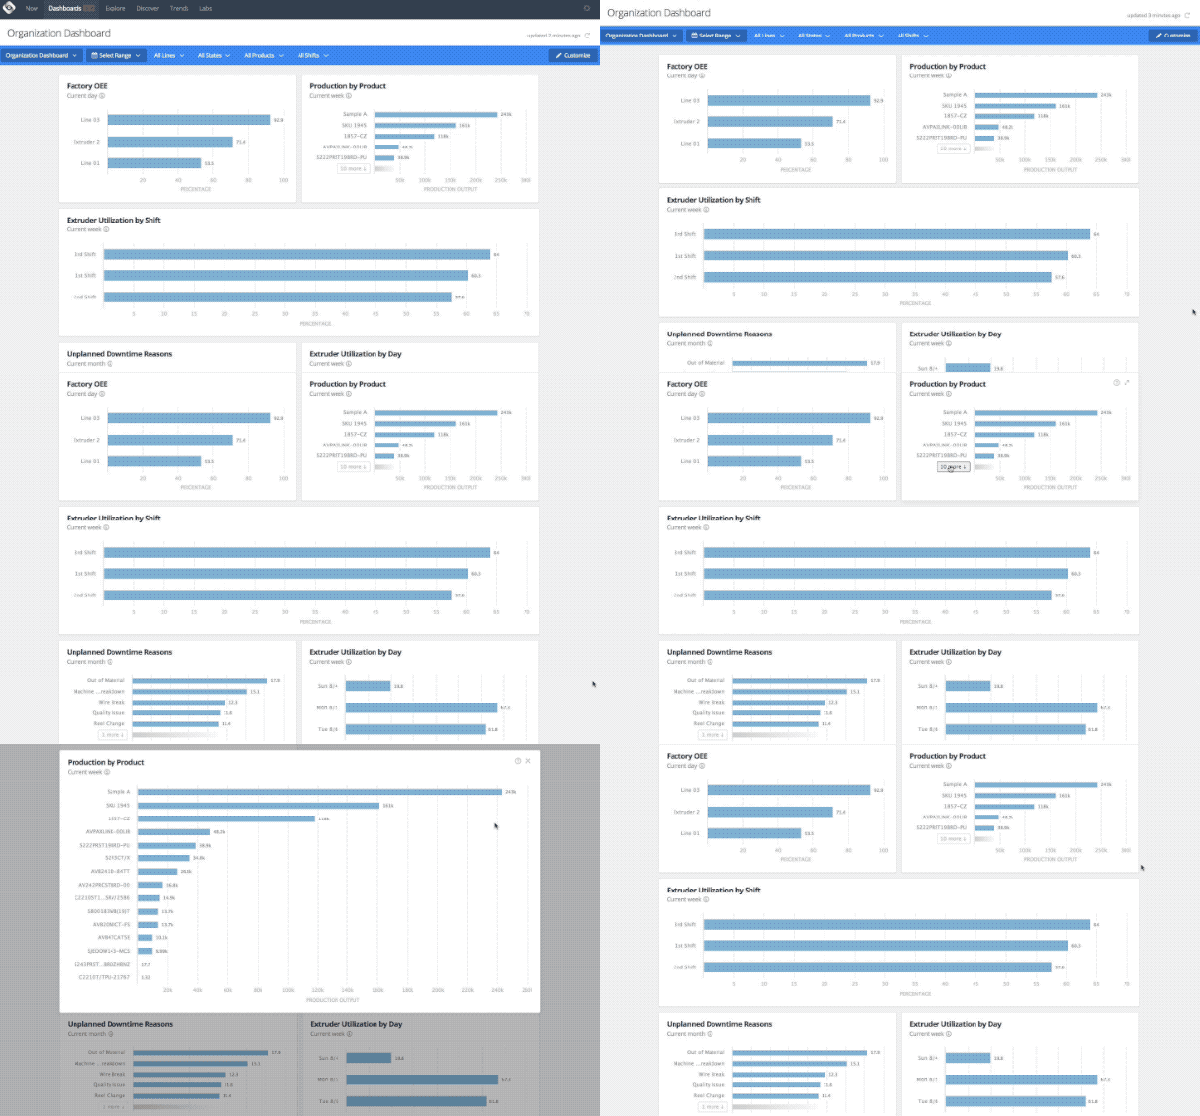
Admins can modify any Dashboard, or add new charts to it, simply by hitting the admin-visible ‘Customize’ button. Any existing chart can then be moved, resized or modified. New charts can be added by hitting ‘Add new chart’ at the bottom of the dashboard, and configuring it to have the right data, filters and time range.

To create a new Dashboard, admins can head to the Oden Settings panel and select the Dashboards option. Here, admins can edit an existing dashboard, or create a new one that will be available to their team.
Check out Dashboards today!
The post Configurable Dashboards for Everyone on the Factory Floor appeared first on Oden Technologies.

